
What is Urban Pollution?
Urban pollution refers to the presence or introduction of hazardous or harmful substances in cities and urban regions, Natural sources may contribute to urban pollution, but human-related emissions are by far the worst. Due to the local concentration of people and human activity, anthropogenic sources of pollution, such as factories, industries, transportation, and so forth, are frequently made worse in cities. For instance, both worldwide environmental issues like global warming and locally sourced environmental problems like waste management, recycling, and light and noise creation have an impact on pollution in cities.
How Chennai is being severely impacted by urban pollution
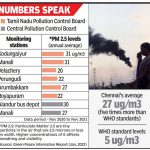
According to research by the non-governmental organization Greenpeace International, which was published in January, the city’s air quality readings for 2021 were five times higher than the World Health Organization’s allowed standards, making it one of the most polluted places in the nation.
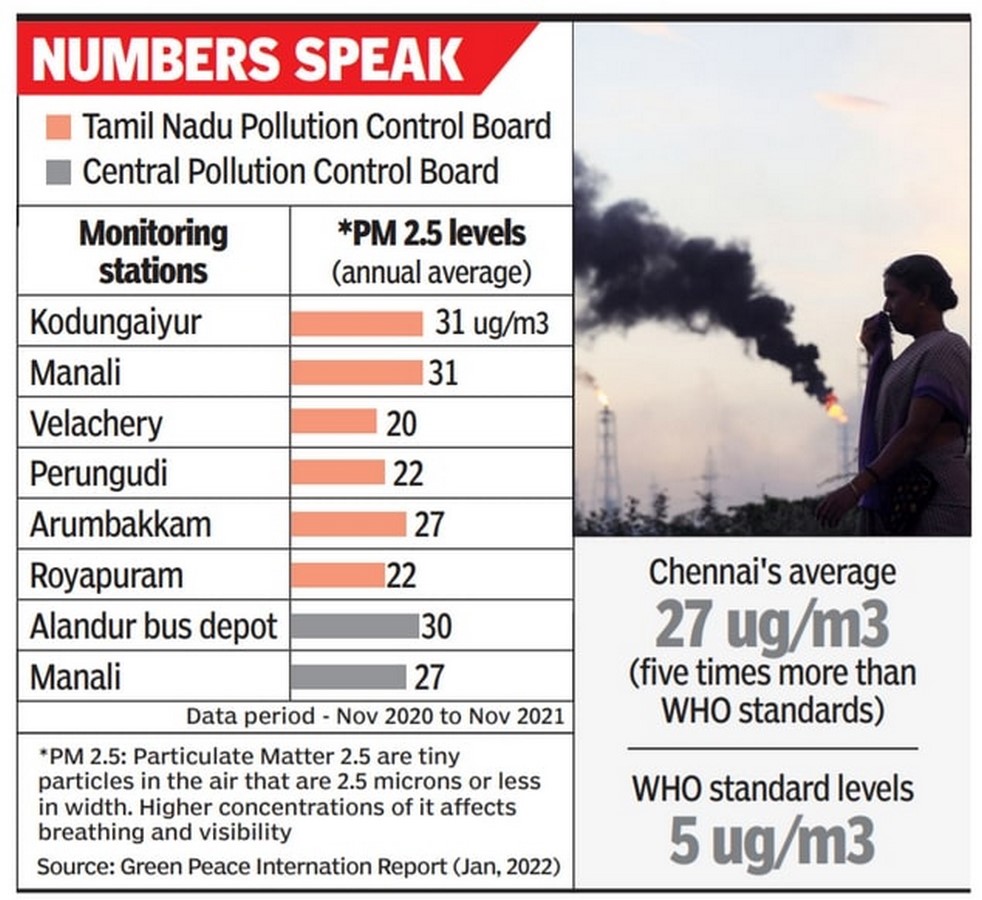
Only Chennai, one of the country’s ten “non-attainment cities,” had particle matter (PM) 2.5 and PM10 levels during the summer months that were within the limits set by the Central Pollution Control Board (CPCB). This was a part of an examination of pollution data gathered between March and June in 10 cities throughout the nation by the National Clean Air Programme (NCAP) tracker: Agra, Bengaluru, Chandigarh, Chennai, New Delhi, Kolkata, Jodhpur, Mumbai, Lucknow, and Patna. The data revealed that only Kolkata and Bengaluru joined Chennai in May and that all other cities in the study had levels over the allowable limits. Chennai was the only city in April with PM10 levels that were within acceptable ranges. The cities were picked because their air did not match the 2011–2015 national ambient air quality criteria, and they were thus categorized as non-attainment cities. For these cities, the NCAP was started to achieve a 20% to 30% reduction in PM2.5 and PM10 particle levels by 2024. The breaching is a blatant example of how, contrary to popular belief, air pollution is a problem all year round and is exacerbated by heat. The yearly average allowable limits set by the CPCB for PM2.5, PM10, and NO2 are 40, 60, and 40 micrograms per square meter, respectively. The permissible limits set by the World Health Organization (WHO) for each of the three pollutants are 5 micrograms/cubic meter, 15 micrograms/cubic meter, and 10 micrograms/cubic meter, respectively.
Health Concerns
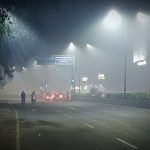
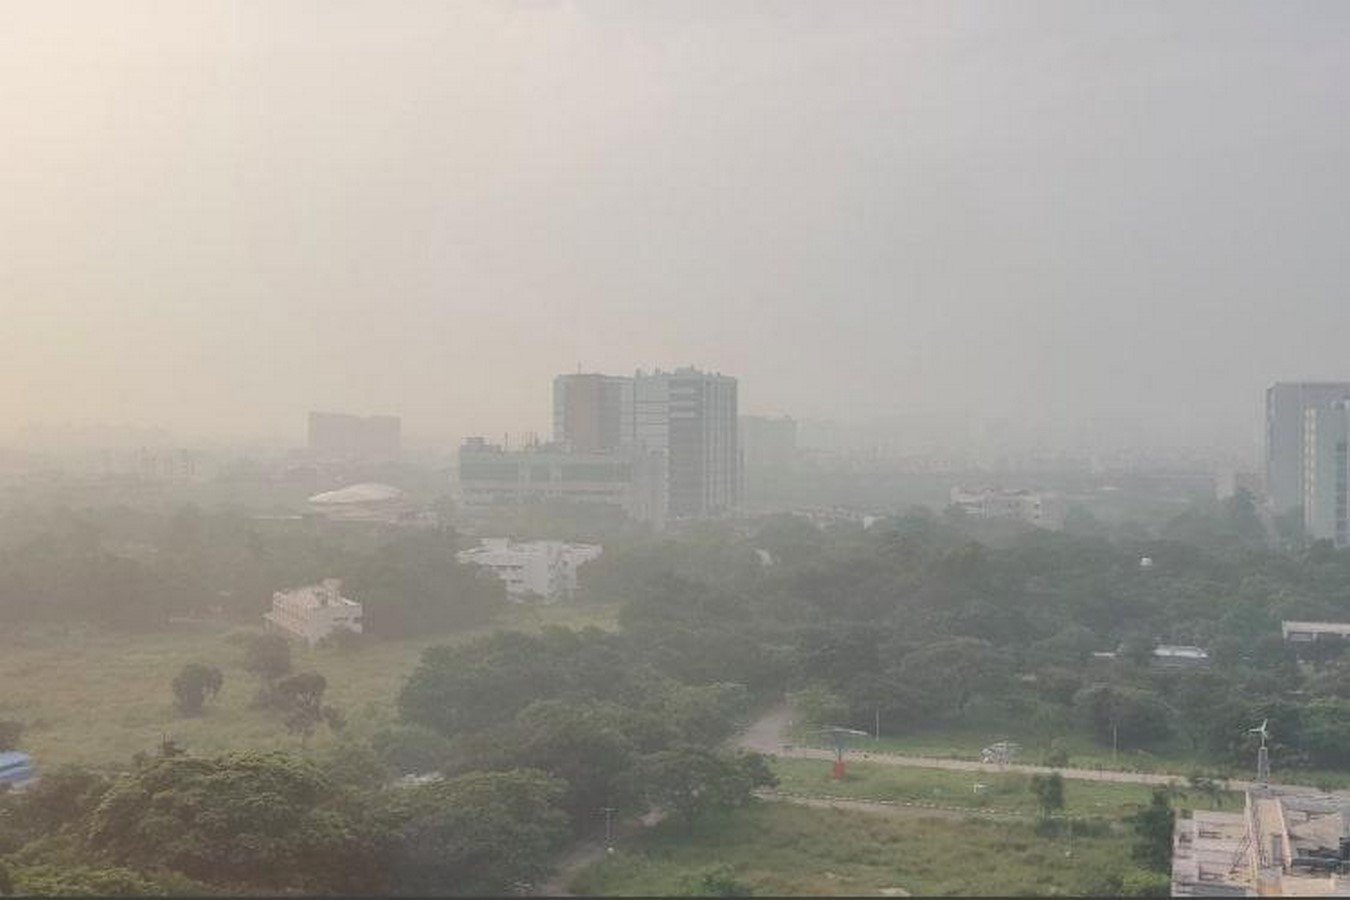
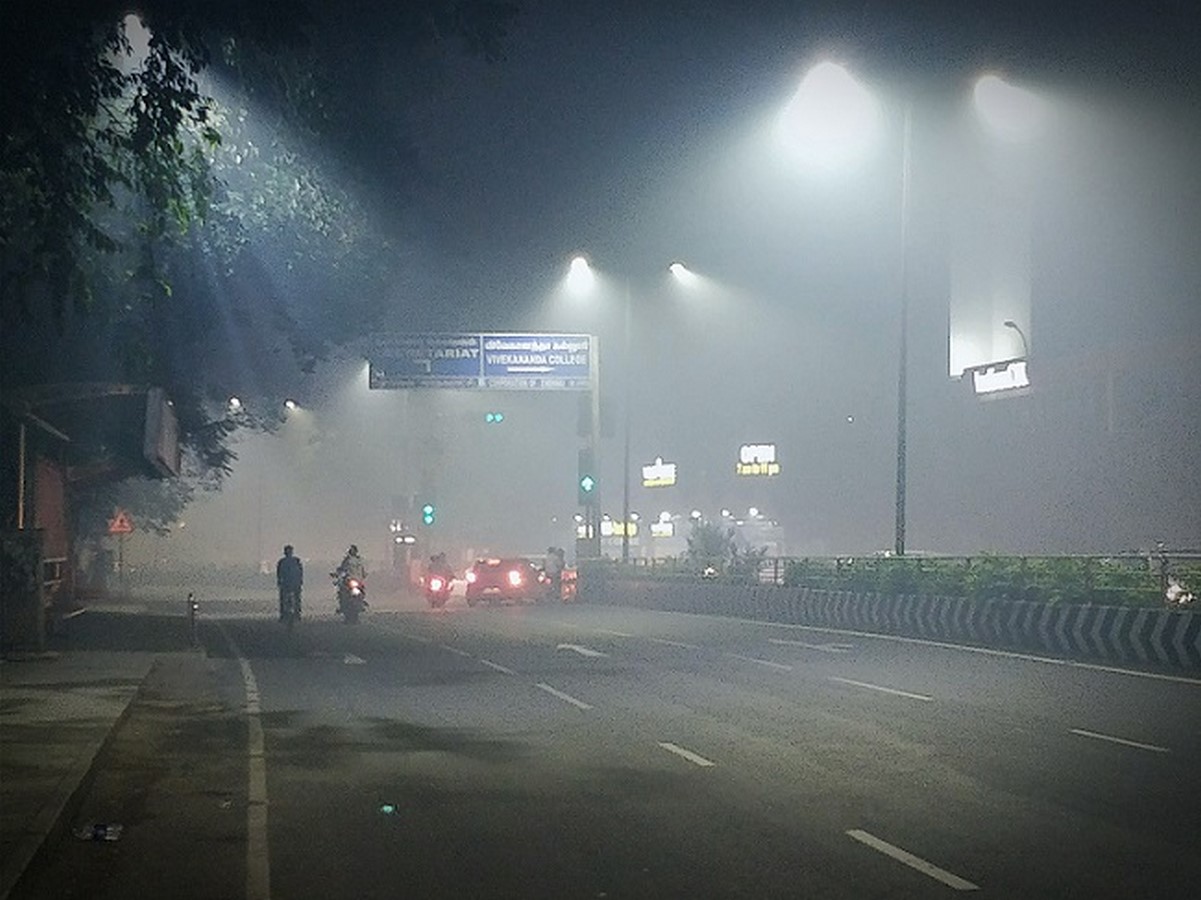
The air boundary layer that keeps pollutants near the surface is much higher during the summer than it is during the winter, providing greater room for the pollutants to disperse. It is concerning if, despite, air pollution levels are higher. Human health is impacted by prolonged exposure to high pollution levels for the majority of the year. According to a recent study, air pollution has decreased life expectancy in New Delhi by up to 10 years and nationwide by 5 years. The study was commissioned by the Energy Policy Institute (EPIC) at the University of Chicago. The report’s assertions and pollution levels were disputed by public health specialists from the Healthy Energy Initiative (India). They argued that due to the high concentration of polluting industries, oil refineries, and thermal power plants near Manali and Ennore, some regions of North Chennai were worst affected by dust and heavy metal pollution. They also emphasized the necessity for the city to receive more monitors.
Additionally, the fifth most common cause of death in India is outdoor air pollution. Experts have been forced to assess pollution trends in India’s cities, including Chennai, as a result of these worrying pieces of information that have caught everyone’s attention.
Significant factors causing urban pollution
While Chennai appears to have deceptively low to moderate levels of pollution due to its proximity to the sea, a recent analysis of Chennai‘s air quality by the Centre for Science and Environment (CSE), a research and advocacy organization based in New Delhi, shows that local impacts and exposure are high and the pollution levels are rising steadily, increasing public health risks. The factors listed below are those that are most accountable for Chennai’s urban pollution.
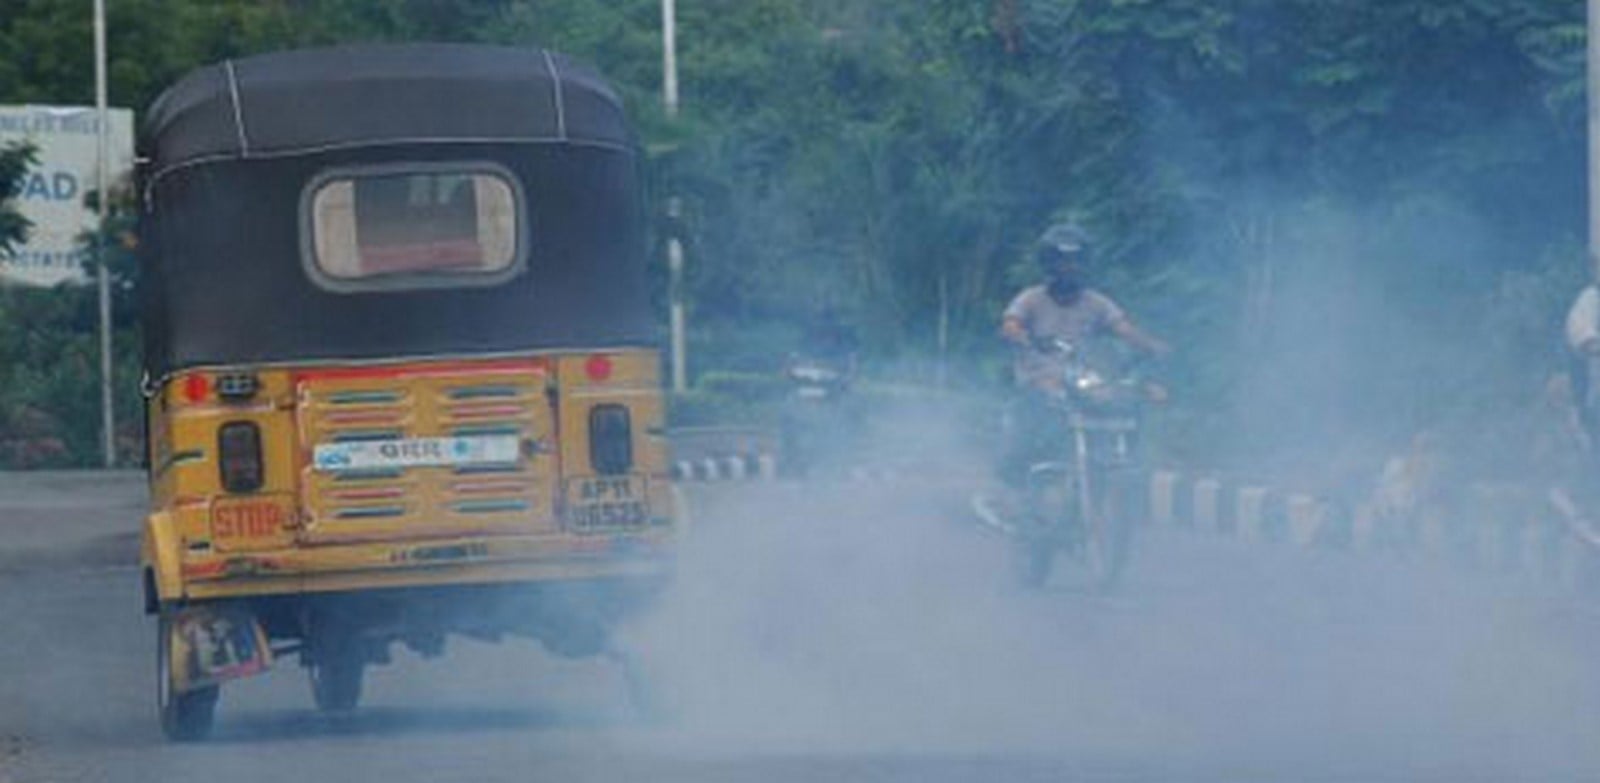
High exposure to vehicle emissions: Dealing with vehicles is particularly difficult. When it comes to exposure, people are more susceptible to car emissions when they are moving and close to roads. One’s breath contains 3–4 times more pollution than the surrounding air does. More than 50% to 60% of people live or work close to the roadside in highly populated cities, where levels are substantially higher. This is an extremely serious issue in areas of low income that are adjacent to major thoroughfares. The most exposed groups are those who use roads, public transportation, pedestrians, and bikers, who also make up the bulk of urban dwellers.
The amount of traffic pollution in Chennai is significant: According to a 2012 study by researchers from the University of Berkeley and published in the journal Environmental Science and Technology, Chennai (72) has one of the highest exposure levels to vehicle emissions among the Indian cities studied, ranking third after Kolkata (150) and Delhi (100) in terms of population-weighted intake fraction, or the grams of vehicle pollution inhaled per gram of vehicle pollution emitted. In 1991, there were fewer than 5 lakh vehicles; today, there is more than 30 lakh. Twenty percent of all vehicles are cars, and fifty-five percent are two-wheelers. Two-wheelers and automobiles account for 31% of all transport journeys and almost 75% of all vehicles on the road. Between 1991 and 2009, the number of two-wheelers increased phenomenally from 4 lakh to 21.6 lakh. From 0.25 to 1.26, the average number of vehicles per household has grown. If two-wheelers are included, personal motorization in Chennai is allegedly higher than in Mexico City. More than 800 new two-wheelers are registered every day in the city.
The decline in the use of public transportation: The city’s percentage of riders on buses, trains, and bicycles has decreased significantly during the last 20 years. The proportion of journeys using personal vehicles has grown. The city’s last mile connectivity has been badly impacted by the complete disappearance of cycle rickshaws. The percentage of trips made on two wheels as opposed to cars has increased significantly.
Congestion: Between 1984 and 2008, the amount of traffic on arterials and other important roadways rose eight-fold. The Chennai Corporation estimated that there were 10 major arterial roads with a trip speed of 31 to 40 km/hour in 1993–1994; Only 3 roads have this kind of speed at the moment. Similar to this, there were just 2 roads back then with an average peak hour travel speed of 11 to 20 km/h. At this point, there are 20 roads in the class. In addition to taking up road space, automobiles are also taking up urban areas to accommodate the insatiable demand for parking.
Even though cars only partially satisfy travel demand, car-centric infrastructure is given priority: Only 7% of daily travel in Chennai is satisfied by automobiles, and 26% by two-wheelers. This indicates that the majority of people either walk or bike or take public transportation. This will gradually weaken Chennai’s comparative advantage in multimodal public transportation. This calls for quick action to expand, reimagine, and rethink sustainable modes to safeguard walking and public transportation, two of the city’s most valuable legacies.
What measures can Chennai take to reduce urban pollution?
Avoid using gated designs: A gate across the main entrance of a gated community blocks regular traffic, while the neighborhood’s surrounding walls and fences further restrict access for the general public. These are isolated, exclusive, and insulated urban forms and the immediate effects include longer travel lengths, a greater reliance on private automobiles, and higher transport energy and pollution intensity for local inhabitants. The habitat guidelines outlined in the National Climate Action Plan and TOD are blatantly violated by this.
A subtle shift: It is good to note that 71 bus route routes have been identified for walkway improvement and design thanks to the efforts of Chennai’s civic society and the Corporation’s responsive policies. This would need to be constructed accurately. The city also has detailed plans to increase the availability of various public transportation options. For them, a thorough multimodal integration plan would be needed. Last mile connectivity must increase for public transportation to be used to its full potential.
Personal vehicles not only take up too much road space but also compete for parking spaces on public lands. According to the 2008 Wilbur Smith research for the ministry of urban development, parking takes up around 27% of the road length in Chennai. Given Chennai’s extensive road system, this is far greater than Bangalore’s 17%, Delhi’s 14%, and Kolkata’s 12%. (19 percent). Even as the city expands its public transportation options, a parking policy must be developed to cut down on the use of private vehicles. In addition to good parking management techniques, this will call for effective on-street parking enforcement and pricing.
Again, by 2022, these numbers would have increased significantly from what was recorded in 2008.
Develop a pedestrian infrastructure, and enhance accessibility: The government ought to impose pedestrian plans and tie money for infrastructure to them. Investments must be explicitly tied to plans for cycling and walking. To provide greater direct legal protection for pedestrian space and rights, the pertinent legislation will need to be harmonized and improved. For targeted pedestrianization, space segregation by users, a system of penalties to deter encroachment in pedestrian space, and prevention of usurping of pedestrian space for motorized traffic without a solid basis, we need a comprehensive Road Users Act. Put walkability audits into action. Plans for public transportation must include a pedestrian integration strategy. Accidents must be tolerated with zero tolerance.
Encourage the development of compact city designs that adhere to the National Habitat Standards for Transportation: The ministry of urban development has created these standards to ensure that developments with housing, employment, entertainment, and civic functions are all within walking distance of public transportation are compact, high density, mixed-use developments near new or existing public transportation infrastructure. Design elements that cater to pedestrians are required.
Create parking regulations to discourage the use of personal vehicles: Promoting public, shared, and open parking is crucial if you want to maximize its benefits and ease the strain on the environment. This needs to be handled and planned so that it satisfies both the needs of the locals and the incoming traffic brought on by the area’s mixed land use. The improvement of design for shared and communal public places should also be a priority. Remove parking subsidies and combine good parking management with reasonably priced parking. Parking restrictions, parking fees, and taxes are the most effective first-generation car constraint measures globally, according to experience throughout the world.
Also, the report’s assertions and pollution levels were disputed by public health specialists from the Healthy Energy Initiative (India). They argued that due to the high concentration of polluting industries, oil refineries, and thermal power plants near Manali and Ennore, some regions of North Chennai were worst affected by dust and heavy metal pollution. They also emphasized the necessity for the city to receive more monitors.
Online sources
Urban Pollution and Emission Reduction
By M. Martínez-Bravo & J. Martínez-del-Río
Available at: https://link.springer.com/referenceworkentry/10.1007/978-3-319-71061-7_30-1
Urban Pollution in India
By Manoj Shrivastava Avijit Ghosh Ranjan Bhattacharyya S. D. Singh
Updated on Oct 2018
Available at: https://www.researchgate.net/publication/328216636_Urban_Pollution_in_India
Chennai air pollution 5 times higher than WHO standards, says report
TNN
Feb 3, 2022,
Available at:
https://timesofindia.indiatimes.com/city/chennai/chennai-air-pollution-5-times-higher-than-who-standards/articleshowprint/89309085.cms
Chennai faces a unique pollution challenge – pollution levels that appear to be low or moderate but are not so.
Centre for Science and Environment
August 6, 2013
Available at:
https://www.cseindia.org/chennai-faces-a-unique-pollution-challenge-pollution-levels-that-appear-to-be-low-or-moderate-but-are-not-so-5078