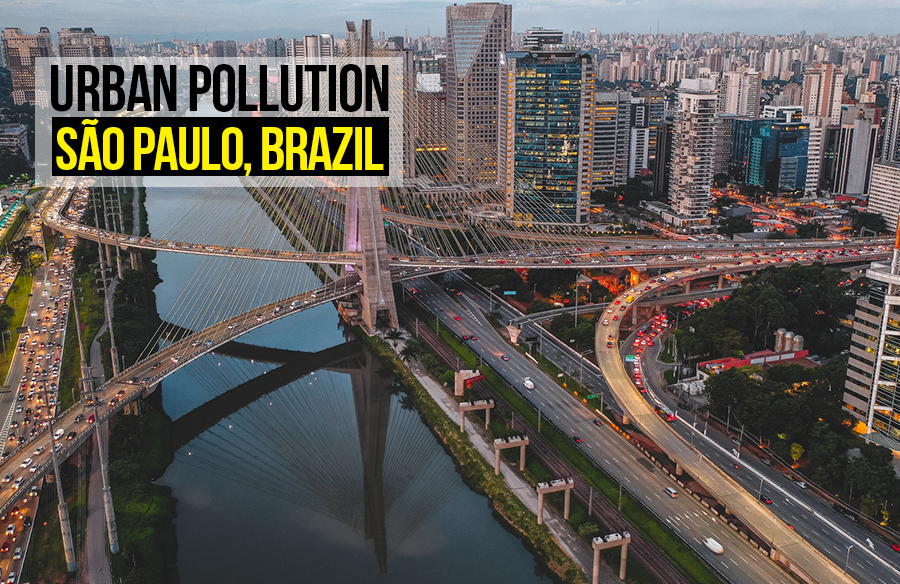
Sao Paulo is a metropolitan city and the capital of Sao Paulo State, Brazil. According to GaWC, it is ranked as the 4th most populous city in the world. With an urban sprawl of 1521 square kilometers, it has a population of over 20 million residents [by the 2022 census] with a growth rate of 0.85% per year, which is 7216 people per square kilometer.

Sao Paulo is Brazil’s cultural, financial, and industrial hub. As the population increases, urbanization increases, and with the increase in urban density comes a lot of challenges. From addressing health issues because of air pollution due to growing industrialization and automobilization, to unsustainable urban development and affordable housing in any global city.

Urban pollution: São Paulo, Brazil - Sheet1
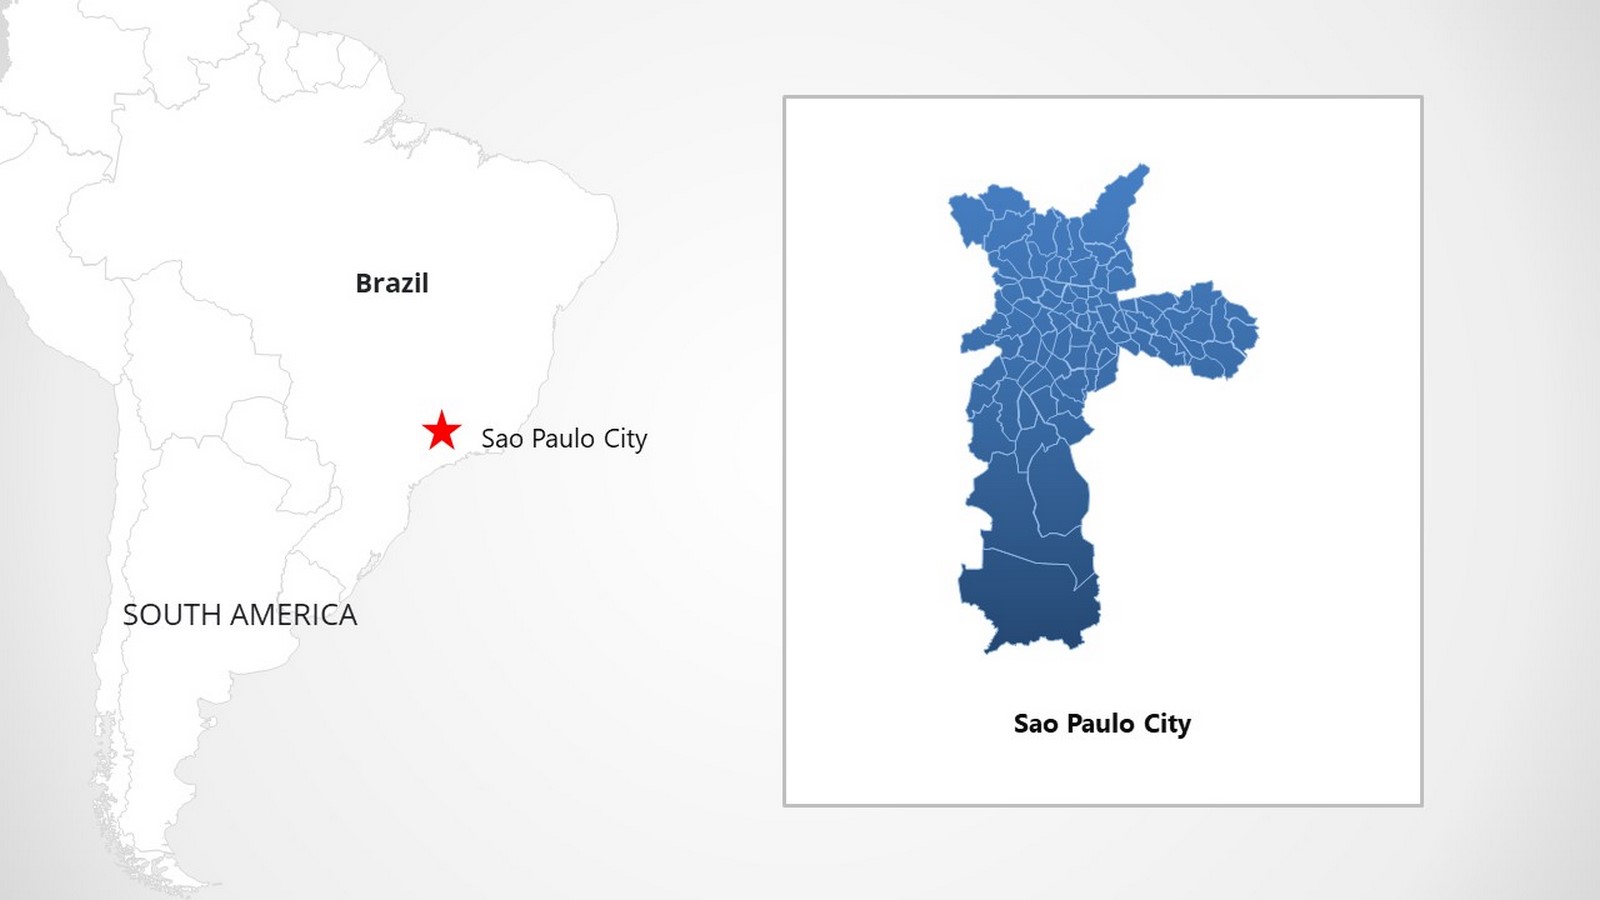
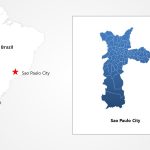
Slidemodel. Location map. [Map]. _©Sao Paulo City PowerPoint Map – SlideModel
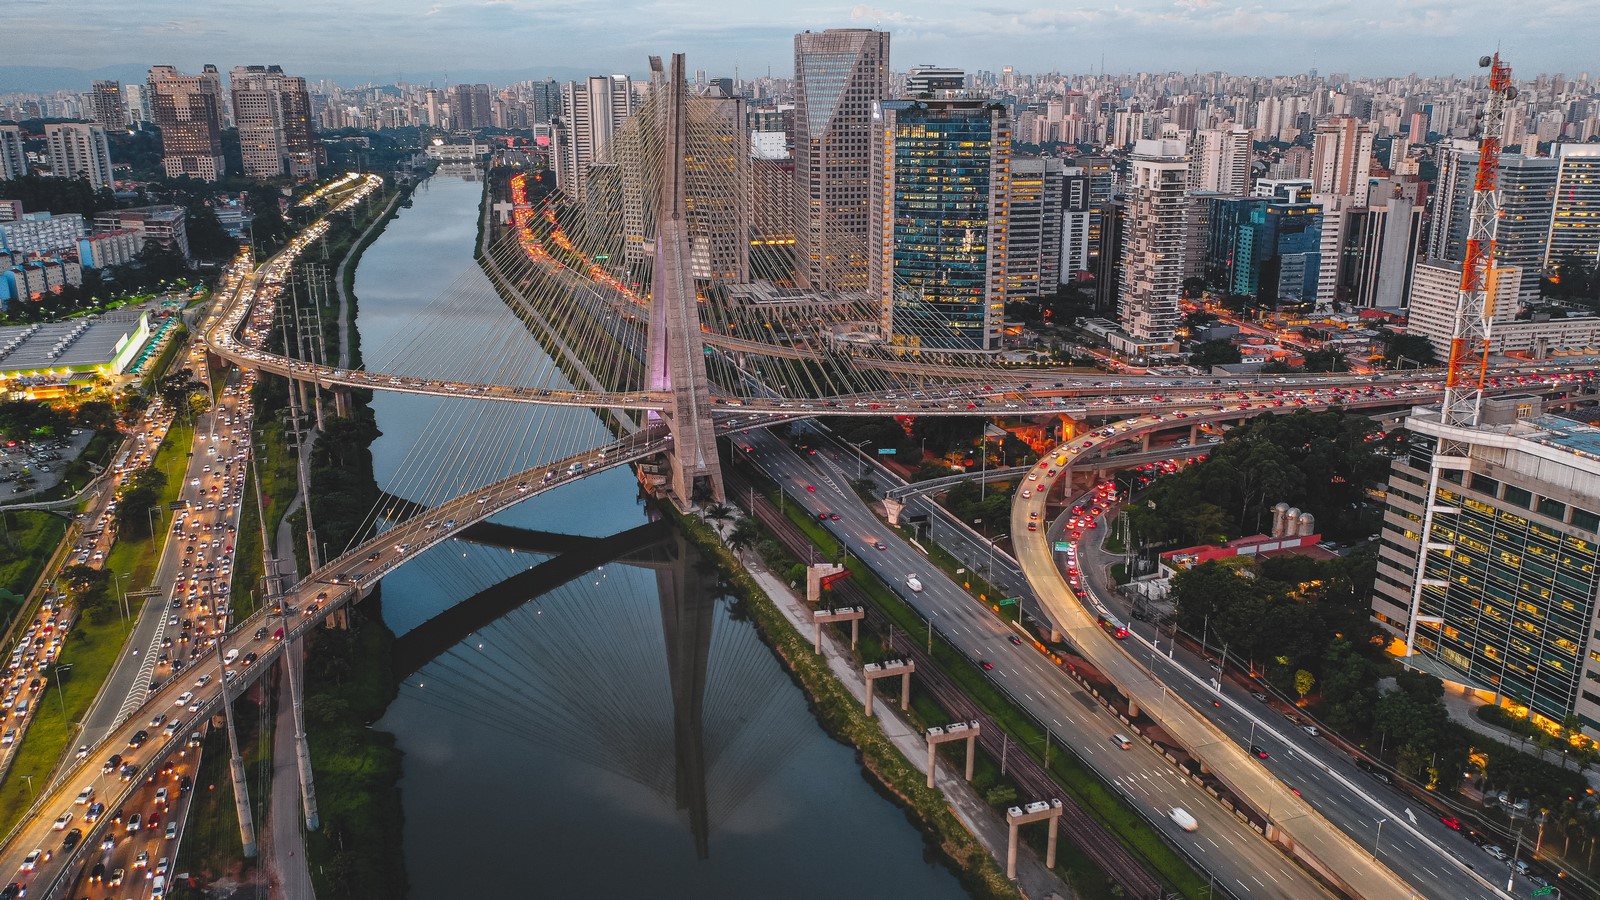
The city of Sao Paulo is located on the plateau of the Brazilian highlands. It has low mountains in the west. It lies about 50 kilometers from the Atlantic Ocean port of Santos. It is the largest city in the southern hemisphere of the world. The architecture of the city is like any of the other metropolitan cities; with striking modern architectural concrete, steel buildings, and huge glass skyscrapers, the urban core of the city is eclectic. Unlike most Brazilian cities, only a few historical buildings dating back to the colonial era can be seen here. 

Urban pollution: São Paulo, Brazil - Sheet2
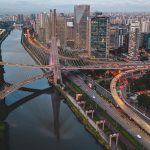
Souza S. The City of Sao Paulo. [Photograph]. _©Mast road bridge over river in megapolis · Free Stock Photo (pexels.com)
At first glance, everything about this city looks amazing because the city has all the facilities that one wants to live a better life. It has good healthcare facilities and educational facilities, a better rate of employment, a better transportation system, and better living conditions, but according to the inhabitants, it’s still the most unlivable city in the world. Why is that?

Urban pollution: São Paulo, Brazil - Sheet3
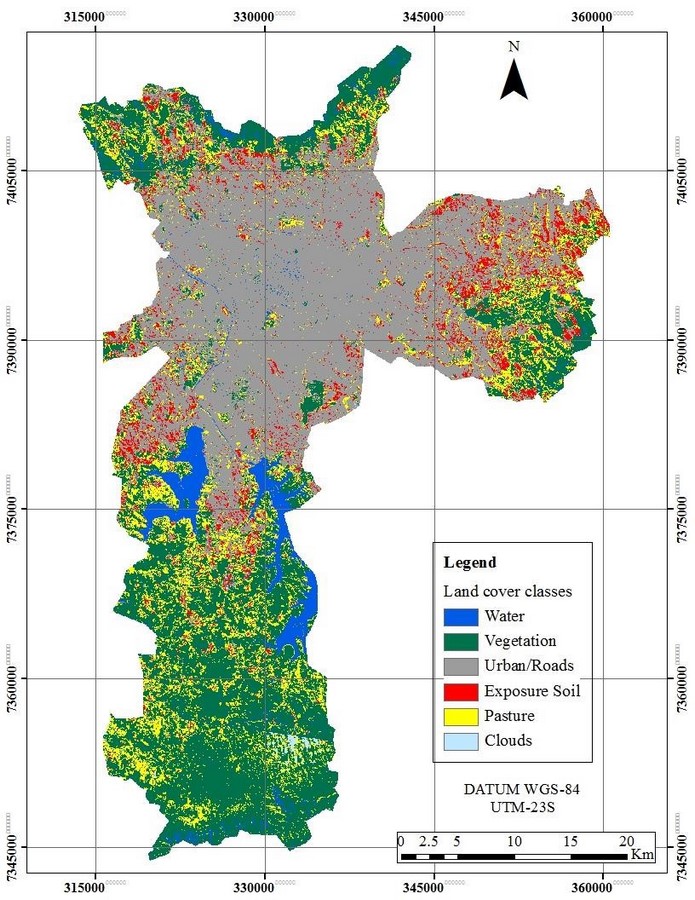
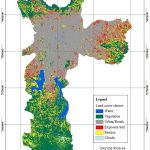
Machado C.(2013). Land cover of Sao Paulo city. [Map]. _©São Paulo City land cover (1986)   | Download Scientific Diagram (researchgate.net)
Urban pollution: São Paulo, Brazil - Sheet4
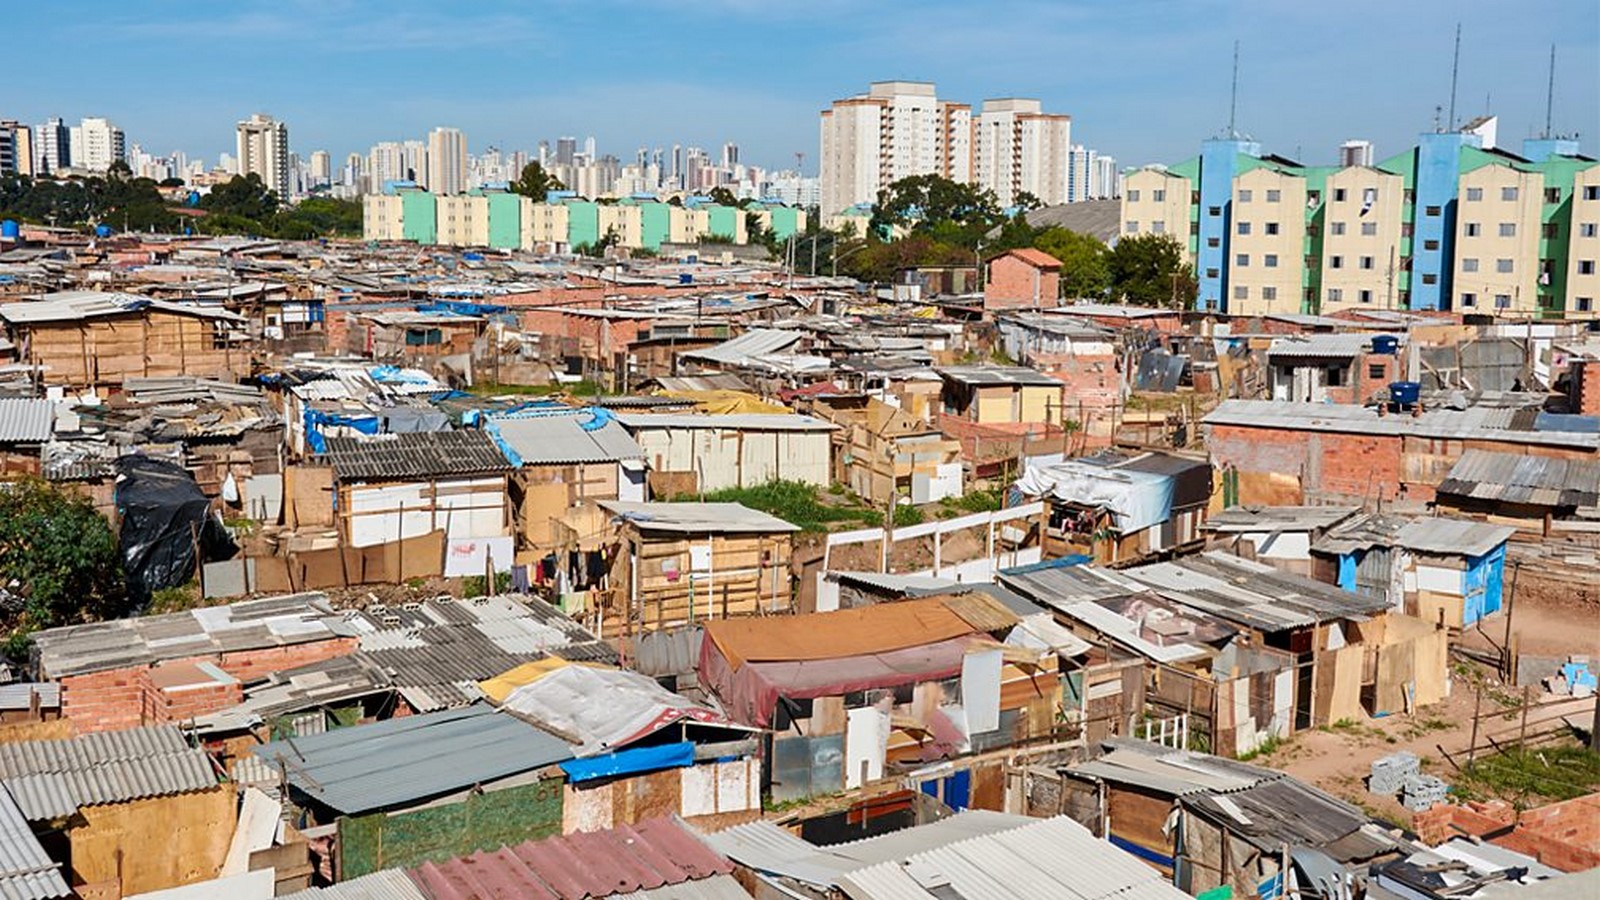
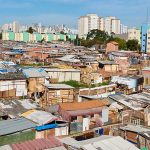
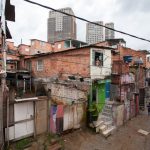
Cifotart. (2017). Favelas in Sau Paulo. [Photograph]. _©Case study: São Paulo, Brazil – Urbanisation in LEDCs – CCEA – GCSE Geography Revision – CCEA – BBC Bitesize
This is the two picture depicting the urban reality of the city. The wealthiest live in one of the expensive high rises, and the poor live in favelas on the riverbanks. 20% of the total population of Sau Paulo lives in favelas. With unhygienic surroundings, nutrition deficiencies, and overpopulation in favelas, the infant mortality rate is high. Due to poverty, the rate of people engaging in crime is increasing.

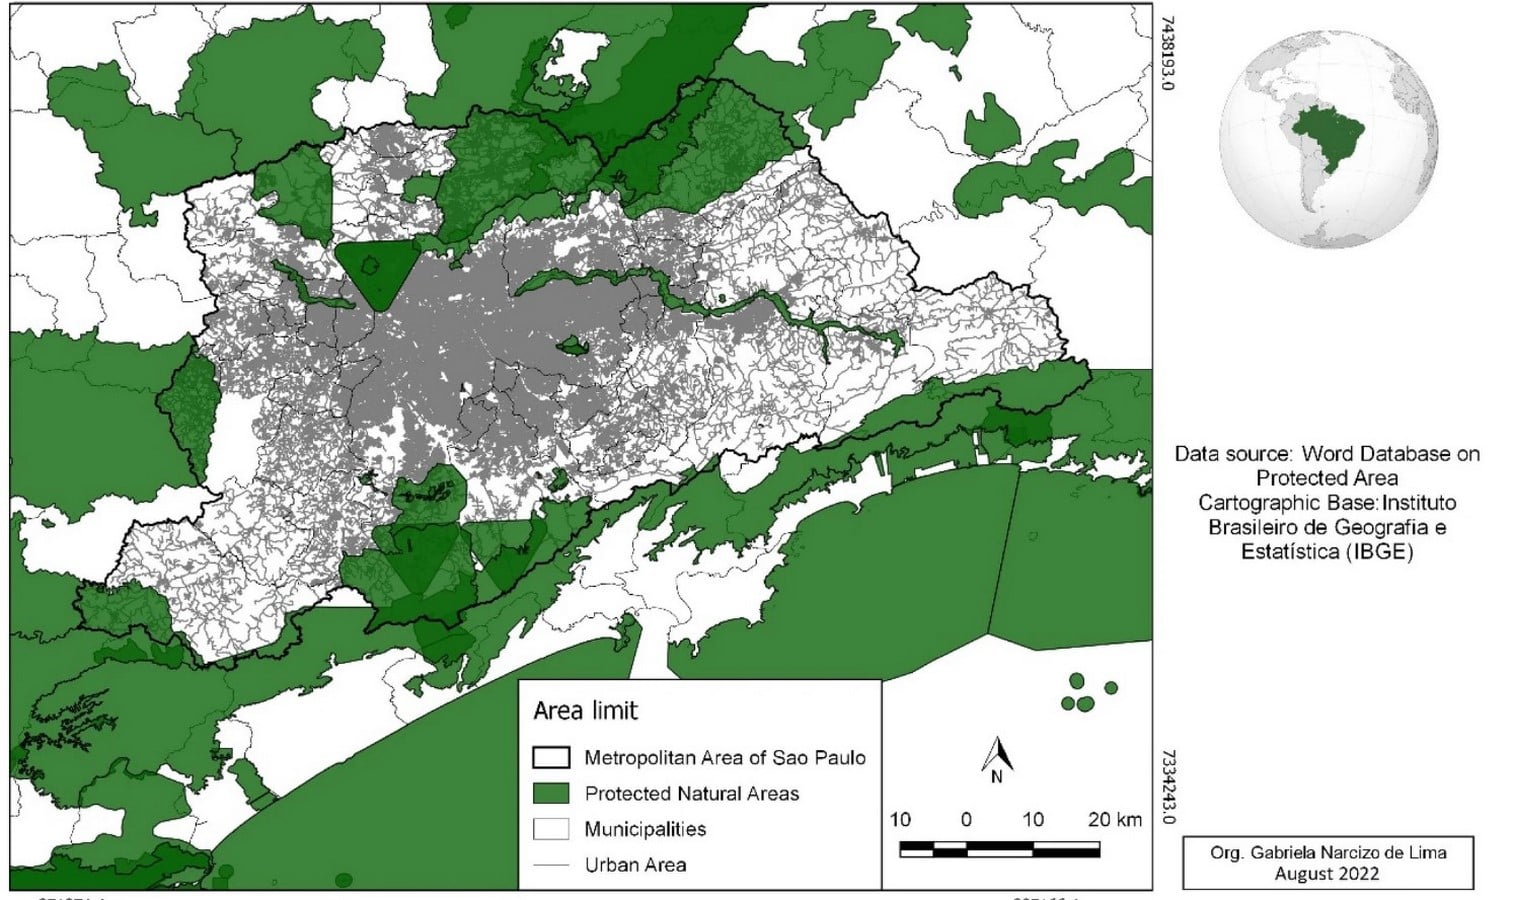
Green spaces help the cities breathe, but with the increase in urban infrastructure, there is a decrease in open spaces, which causes a change in the geographical distribution of urban heat islands, increases surface runoff, and results in floods during monsoons. Green pockets in urban areas are replaced by car parking.

Urban pollution: São Paulo, Brazil - Sheet5
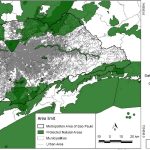
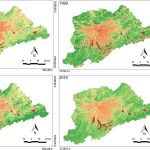
Lima G (2023). Green cover in the metropolitan area of Sao Paulo. [Map]. _©https://link.springer.com/article/10.1007/s11252-023-01394-0/figures/2
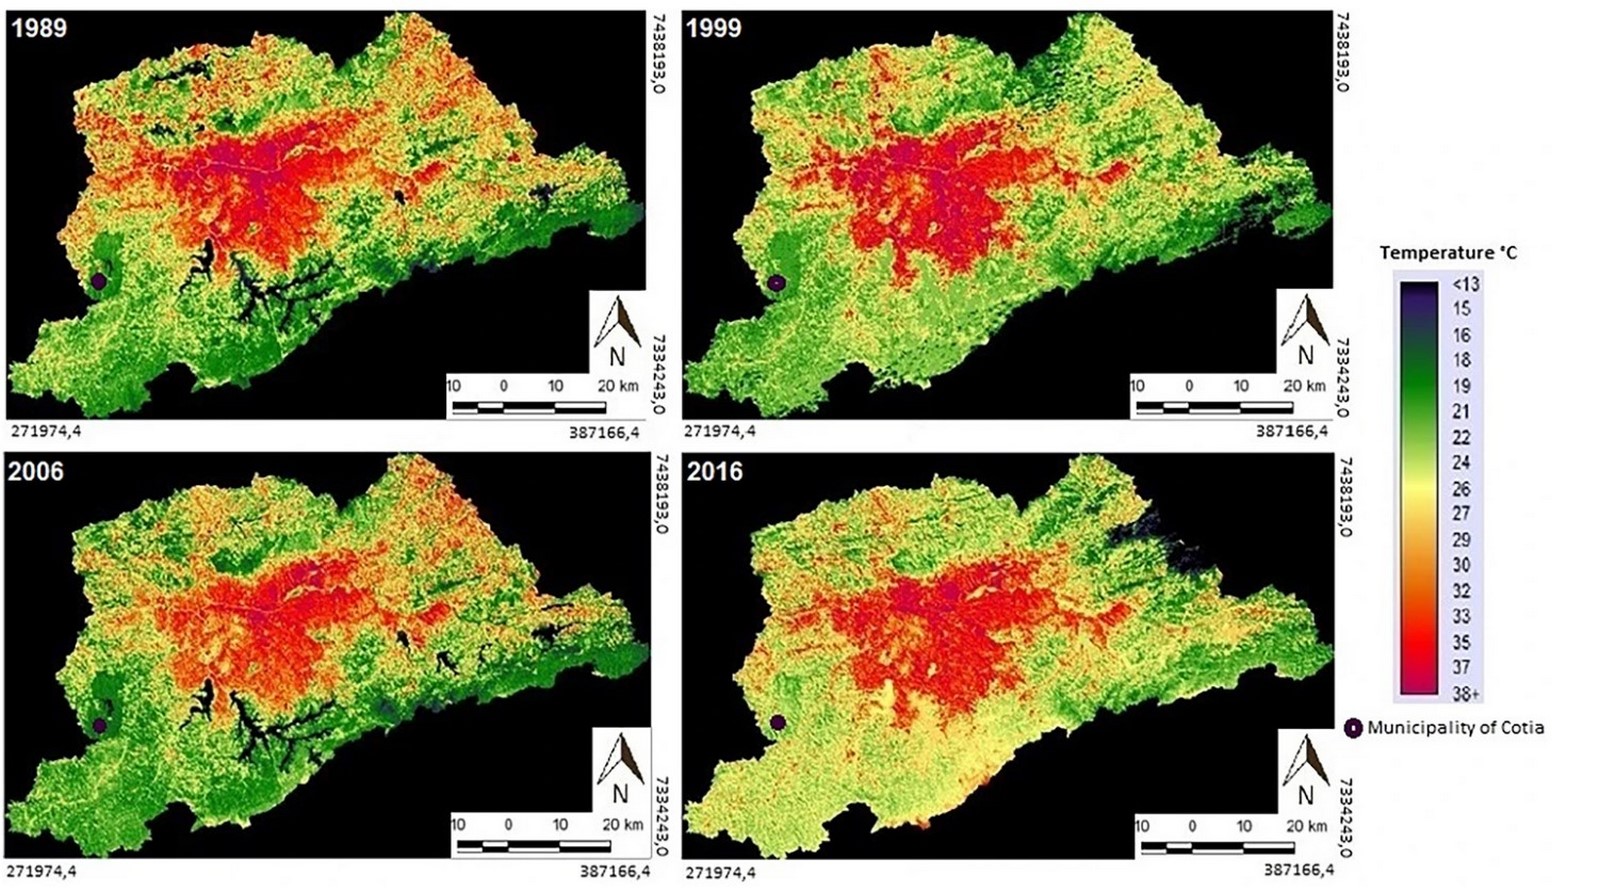
Cities develop an ‘Urban Heat Island’ when they replace vegetative cover with concrete buildings and pavements that hold the heat and absorb it. In terms of world-wise cities, Sao Paulo has the fourth largest urban heat island effect. It is 5 degrees hotter than the surrounding cities, which is harmful to human well-being. This also increases energy consumption, which results in higher air pollution levels.

Urban pollution: São Paulo, Brazil - Sheet6
Lima G (2023). Surface temperature in summer in the metropolitan area of Sao Paulo. [Map]. _©https://link.springer.com/article/10.1007/s11252-023-01394-0/figures/2
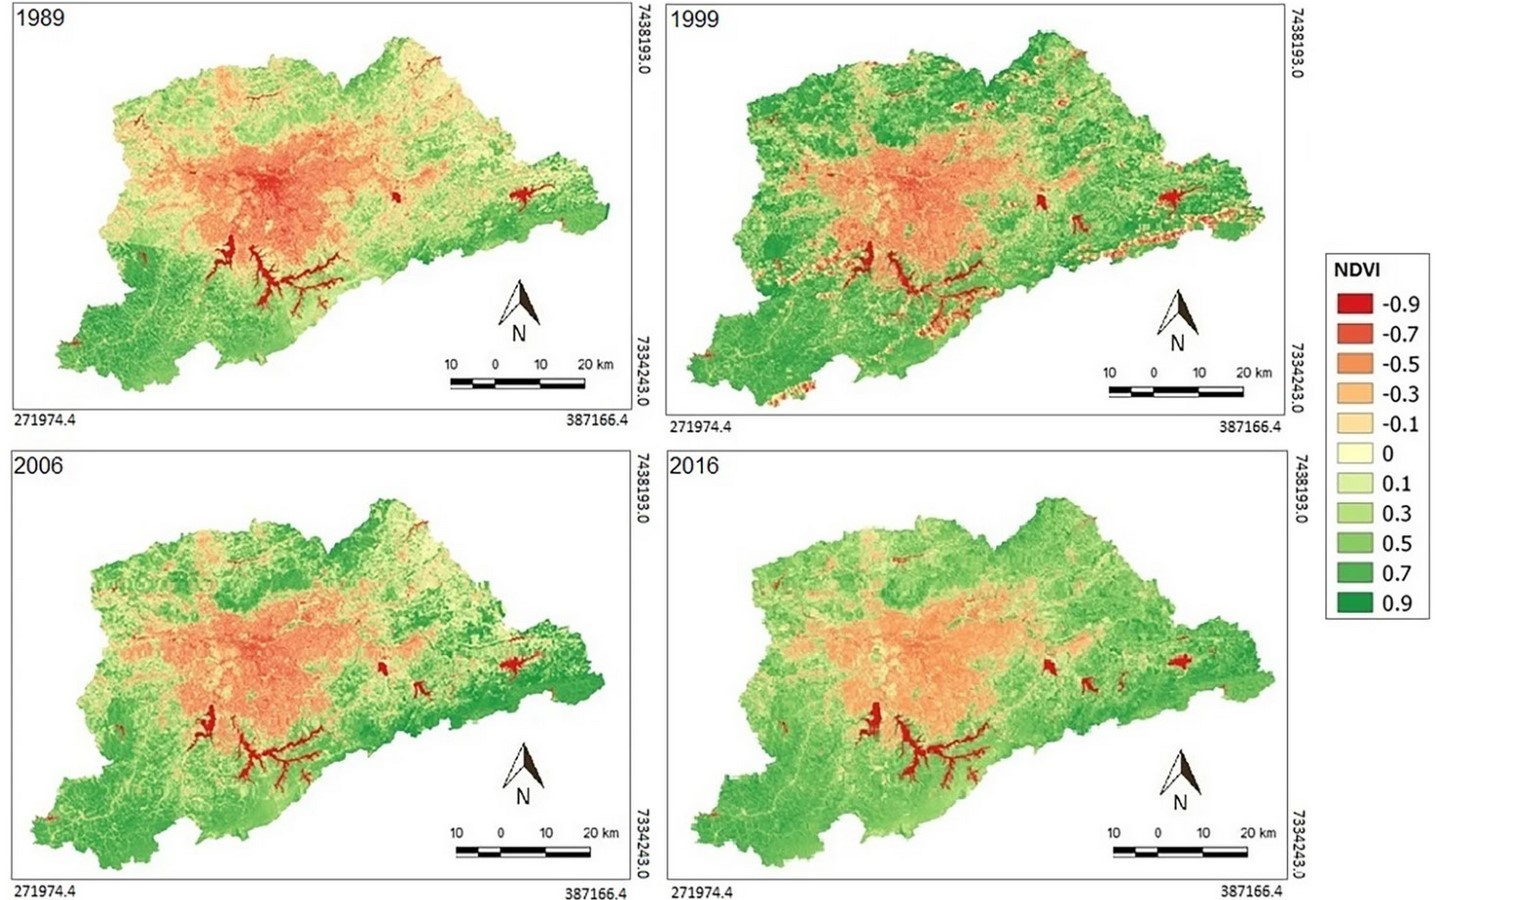
The lowest spatial values of the surface temperature gradients for the metropolitan area of Sao Paulo were between 16 and 18 degrees and were mainly concentrated in the south and southeastern regions of the Sao Paulo Green Belt Biosphere Reserve. In the northern, central, and eastern regions, the highest surface temperature of 30 degrees can be seen, which is the result of a lack of vegetation. The urban zones and the peripheral zones of the city have moderate ‘UHI’ because of the substantial degree of afforestation, but with the growing urbanization, the native vegetation is likely to be withdrawn for future urban developments, which will eventually result in high UHI.

Urban pollution: São Paulo, Brazil - Sheet7
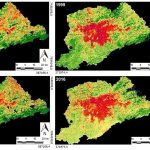
Lima G (2023). Vegetation index in summer in the metropolitan area of Sao Paulo. [Map]. _©https://link.springer.com/article/10.1007/s11252-023-01394-0/figures/4
With over 40,000 industries and 6 million jobs, there are over 5.7 million car owners. Sau Paulo comes in the lower bracket of the pollution bracket. The main cause of poor air quality is the emission of harmful gases by vehicles and industries. With the majority of people exposed to such a harmful environment, many health issues are occurring among them.

Urban pollution: São Paulo, Brazil - Sheet8
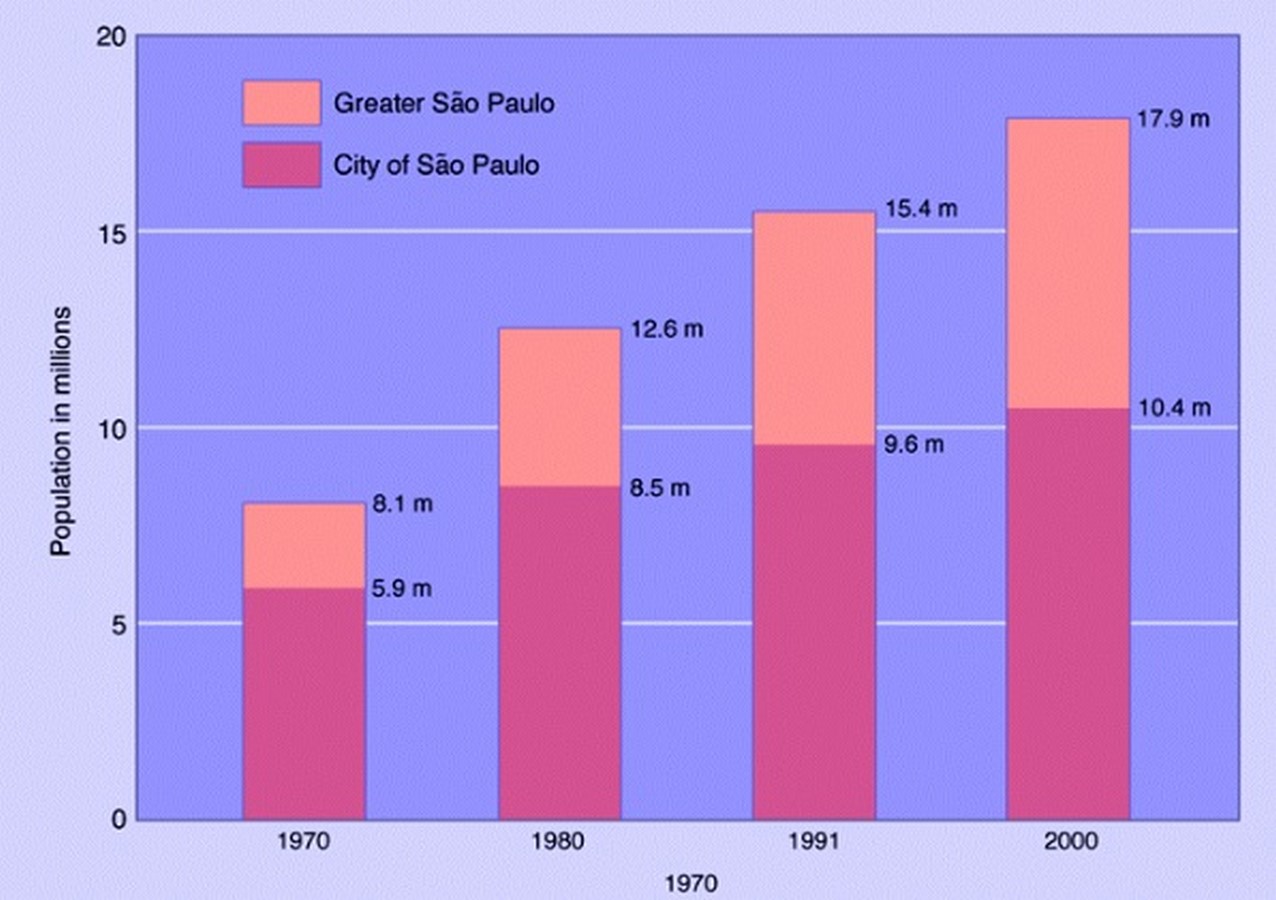
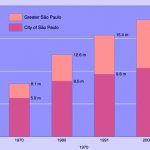
Unknown. Population growth in Sau Paulo. [Map]. _©https://studylib.net/doc/18174099/sao-paulo–population-and-slum-housing
Urban pollution: São Paulo, Brazil - Sheet9
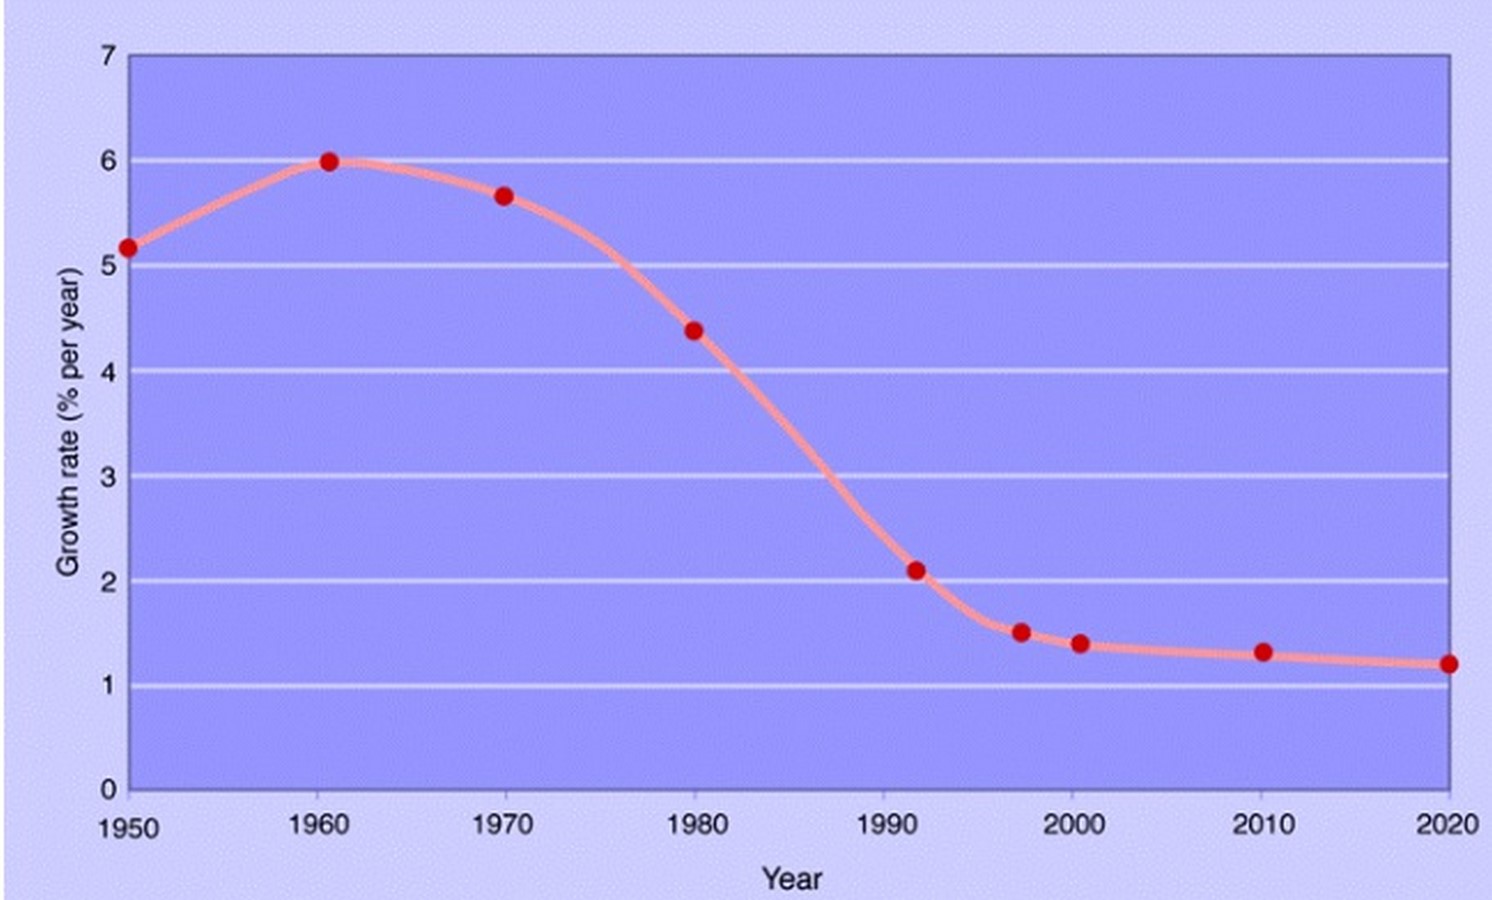
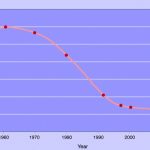
Unknown. Population growth rate in Sau Paulo. [Map]. _©https://studylib.net/doc/18174099/sao-paulo–population-and-slum-housing
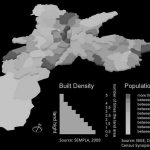
Duarte D. (2012). Built density and population density in Sau Paulo. [Map]. _©Built and population density in the city of São Paulo (by districts)  | Download Scientific Diagram (researchgate.net)
This diagram shows the built-up population density of the city. According to the analysis, areas with vertical housing or formal settlements have a higher built density and a lower population density than areas with horizontal housing or informal settlements. Here, the relation between built density and population density is the housing typology of the place, land use, and work opportunity. Central areas have better availability of transport and infrastructure than peripheral areas, which results in central areas being highly populated. Most favelas are located in peripheral areas, which have a low quality of life and poor infrastructure.

Image 11_Unknown. (2012). Favelas in Sau Paulo. [Photograph]. _© São Paulo Is Betting Better Urban Planning Can Solve a Housing Crisis (nextcity.org)

To balance the formal and informal settlements, it’s important to first map them, formalize them, and then protect the inhabitants from displacement.

So, the question arises here: whether to build or not to build more. – To stop the further decline in the sustainability of cities, cities can be better planned with the implementation of eco-system-based spatial planning. The unbalanced urban settlements can be de-densified. Slum upgrading and town planning could be the solution to tackle overcrowding and space issues and make cities liveable, safe, sustainable, and affordable. Slum upgrading is a cost-efficient investment that can reduce social disruption caused by relocation or eviction and avoid economic fallout caused by removing informal developments. It is important to conserve the green land cover of the city and maintain the balance of concrete to open land so Urban Heat Island will be in control.

Reference list  

  1. Sao Paulo: Population and Slum Housing (no date) studylib.net. Available at: https://studylib.net/doc/18174099/sao-paulo–population-and-slum-housing (Accessed: 17 September 2023). 
  2. Designing your company’s sustainability report (2022) Harvard Business Review. Available at: https://hbr.org/2022/01/designing-your-companys-sustainability-report (Accessed: 17 September 2023). 
  3. Holmes, C. (2016) São Paulo is betting better urban planning can solve a housing crisis, Next City. Available at: https://nextcity.org/features/sao-paulo-housing-crisis-master-plan-zeis-haddad-habitat-iii (Accessed: 17 September 2023). 
  4. Yixin CaoWendy Yan ChenKarl Matthias Wantzen et al. (no date) Urban Ecosystems, Springer. Available at: https://www.springer.com/journal/11252 (Accessed: 24 September 2023). 
  5. Case study: São Paulo, Brazil – urbanisation in LEDCs – CCEA – GCSE geography revision – CCEA – BBC Bitesize (no date) BBC News. Available at: https://www.bbc.co.uk/bitesize/guides/zx7ypbk/revision/4 (Accessed: 24 September 2023). 
  6. Beccario, C. (no date) A global map of wind, weather, and ocean conditions, earth. Available at: https://earth.nullschool.net/ (Accessed: 24 September 2023). 
  7. Spatializing inequality across residential built-up types: A relational geography of urban density in São Paulo, Brazil. – ScienceDirect
Author

Shraddha is an architect who loves traveling and documenting things, people, stories, and moments. From sketching to reading, she enjoys exploring the world of art through all its forms. Being creatively inclined, she is intrigued by everything about art and creation. She is also a movie buff.