Introduction
The growth of e-commerce continues to make Amazon one of the most profitable destinations for any online seller. Still, not only is competition getting tighter, but diving into profit margins and costs means the difference between success and failure. Amazon’s Profit Dashboard has all the vital insights which, when understood well, can make a huge difference in your business. The idea of this guide was born with how one can use the Amazon Profit Dashboard to gain insights into monitoring, managing, and maximizing their profits with efficiency.
1. What is an Amazon Profit Dashboard?
The Amazon Profit Dashboard is the professional tool of the seller, helping him analyze and monitor profitability on the platform. It allows sellers to get a perfect overview of the financial state of their business-from all data on sales costs to profit margin metrics.
The Profit Dashboard allows the seller to see, in one intuitive view, how much they make on each sale, assess their operational costs, and make some savvy pricing choices to grow their bottom line.
2. Why Understand Profit Margins
The margins are what make a business viable in the first place. Even if you’re making high sales volume, hidden costs can eat into your revenue and whittle away at your profit. Key benefits of understanding your profit margins include:
Pricing Strategically: Never underestimate or overestimate the price for your products.
Cost Control: Lower the variable and fixed costs.
Data-Informed Decisions: Always make better business decisions by using data insights to drive profits.
3. Features of Amazon Profit Dashboard
The Amazon Profit Dashboard is designed with a variety of features that showcase an in-depth look at your financial statistics. The following illustrates some of its key features:
Sales Metrics: Daily, weekly, and monthly sales amounts.
Expense Breakdown: It showcases various costs associated with Amazon fees, shipping, and storage.
Calculations of Net Profit: It provides a clear calculation of your net earnings.
Gross Profit Insights: Gross profit calculations help to adjust the operational strategy accordingly.
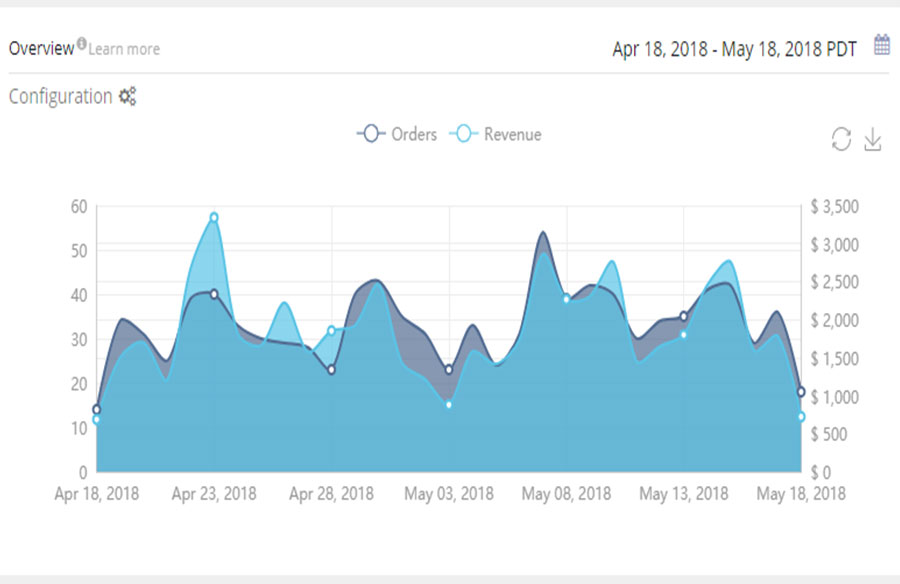
Visual Analytics: Graphs and charts on visual analytics of financial trends.
Each of these features provides a seller with comprehensive insight into their finances; accordingly, they can always look for opportunities where they need to increase their investment or where they should cut the costs.
4. How to Set Up Your Amazon Profit Dashboard
Setting up your Amazon Profit Dashboard is the first step towards the tracking of your profits accurately. Here’s how you do it, step by step:
Step 1: Login to Your Seller Central Account
Log in to your Amazon Seller Central account. Usually, the Profit Dashboard is available under the “Reports” section.
Step 2: Customize Your Dashboard
Amazon’s Profit Dashboard allows you to customize it according to your needs. You can select the metrics and data periods which will apply most to your business.
Step 3: Set Reporting Frequency
Set your reporting frequency to keep track on a regular basis. It will keep your eyes on profitability trends on a week-to-week, month-to-month, or quarter-over-quarter basis.
Step 4: Add Additional Financial Tools
For even deeper insights, you could integrate additional third-party tools that are compatible with Amazon’s Profit Dashboard.
5. Knowing the Key Metrics on the Dashboard
Once you have already set up your Amazon Profit Dashboard, it is important that you know about the key metrics of this account:
A. Sales Revenue
Total revenue from the sale of products, net of all fees. Allows the tracking of gross sales performance.
B. Cost of Goods Sold
COGS reflects all costs directly related to the production and selling of goods. The ability to track COGS allows for the proper calculation of gross profit.
C. Amazon Fees and Other Expenses
Allows you to subtract Amazon fees, which include referral fees, storage fees, and FBA charges, from revenue to derive your net income.
D. Net Profit
This is the final figure after deducting all costs and fees. Net profit is one of the most critical figures that a sustainable business needs.
E. Profit Margin
The profit margin is the percent of revenue that remains as profit after accounting for all expenses. Your profit margins need to be tracked to determine if your pricing is aligned with your revenue goals.
6. Using the Profit Dashboard for Business Growth
The seller can strategically apply the insights availed by the Profit Dashboard in the creation of a more propitious operation to grow their businesses. Here’s how:
Optimize Pricing Strategies
You will know just how to price your items by analyzing your net profit and profit margins so that your sales will be higher, but not at the expense of your profitability.
Monitor Inventory Levels
Overstocking or understocking impacts your profits in terms of storage fees or missed sales opportunities. Regular monitoring will create a balance in your supply and demand.
Operate at Reduced Costs
Identify high operational costs and find alternatives. This might mean changing suppliers, negotiating shipping rates, or even changing your packaging.
Seasonal Adjustments
Leverage the insights in the dashboard to predict seasonal changes. You can adjust your pricing, stock up, or run promotions depending on trends over time.
7. Common Challenges and Solutions
With all its benefits, using the Amazon Profit Dashboard also means one or two challenges that must be overcome by the seller:
Problem 1: Incorrect Cost Tracking
If not all expenses are factored in, the net profit might show more than it actually will be. Costs of inventory, storage, and shipping should be continuously updated for accuracy of data.
Problem 2: Too Much Data
There is so much data that can be overwhelming for some sellers, especially those who are just starting out. Key metrics to familiarize yourself with are things like COGS, profit margin, and Amazon fees. Advanced analytics, though helpful in other ways, can wait until later.
Problem 3: Seasonality and Market Fluctuations
Market demands usually fluctuate on a seasonal basis. Monitoring such fluctuations through the Profit Dashboard will enable sellers to take an appropriate course of action well in advance to maintain competitiveness.
8. Expert Tips to Maximize Profitability
The following are some more expert tips for advanced sellers that need to take their Amazon Profit Dashboard to the next level:
A. Automated Replenishment of Inventory
By resorting to automated tools in maintaining optimum inventory levels, you would avoid running out of stock-a precursor to missed sales.
B. Monthly Profit Analysis
Only review your profit dashboard monthly to find trends, seasonality, and opportunities to cut costs or invest.
C. Invest in High-ROI Products
Find the products that make the highest margin of profit and promote those product categories by expanding.
D. External Advertising
Leverage off site advertising using social media or Google to divert traffic to high-margin products listed on Amazon.
Conclusion
The Amazon Profit Dashboard is an advanced, powerful tool that lets sellers stay on top of their financial performance. Each component being known and utilized strategically will lead to better profitability for sellers, reducing unnecessary expenses to scale the business effectively.
To learn more about maximizing your profitability on Amazon, check out My Real Profits Profit Dashboard.